Historical EA funding data: 2025 update
webAuthor
Credibility Rating
Good quality. Reputable source with community review or editorial standards, but less rigorous than peer-reviewed venues.
Rating inherited from publication venue: EA Forum
Relevant to AI safety insofar as it tracks shifts in EA funding toward AI and longtermist priorities; primarily useful for understanding the institutional and financial landscape of EA grantmaking rather than technical AI safety content.
Forum Post Details
Metadata
Summary
This post compiles and analyzes historical grant data from major EA funders (EA Funds, GiveWell, Open Philanthropy, Survival and Flourishing Fund) through 2025. It initially identified a post-2022 decline in EA grantmaking and a shift from global health toward AI and longtermist priorities, but revised these conclusions after incorporating additional data sources. The analysis provides a quantitative overview of EA funding trends while noting data incompleteness and comparability limitations.
Key Points
- •Aggregates grant data from EA Funds, GiveWell, Open Philanthropy, and Survival and Flourishing Fund through 2025.
- •Initial analysis suggested a downward trend in EA grantmaking since 2022, later revised after incorporating more complete data.
- •Observed a potential shift in funding priorities from global health toward AI safety and longtermist causes.
- •2025 data remains incomplete and has limited comparability with earlier years, urging caution in trend interpretation.
- •Provides a useful empirical baseline for understanding how EA institutional funding has evolved over time.
Cited by 2 pages
| Page | Type | Quality |
|---|---|---|
| EA and Longtermist Wins and Losses | -- | 53.0 |
| FTX Collapse: Lessons for EA Funding Resilience | Concept | 78.0 |
Cached Content Preview
# Historical EA funding data: 2025 update
By Jacco Rubens🔸
Published: 2025-11-14
*NOTE: Original post updated with additional data, which impacts some conclusions / observations - see "Updated data" section for further details.*
Check out [this post](https://forum.effectivealtruism.org/posts/rohYFGfiFjepLDnWC/ea-grants-database-a-new-website?utm_campaign=post_share&utm_source=link) for more up-to-date and interactive data.
I was searching for summary data of EA funding trends, but couldn't find anything more recent than [Tyler's post from 2022](https://forum.effectivealtruism.org/posts/ZbaDmowkXbTBsxvHn/historical-ea-funding-data?utm_campaign=post_share&utm_source=link). So I decided to update it. If this analysis is done properly anywhere, please let me know.
[The spreadsheet is here](https://docs.google.com/spreadsheets/d/1cwV2zx_gDvfpfopZx9FzHXLx5HVUBqLfF28QDqoOwHg/edit?usp=sharing) (some things might look weird due to importing from Excel to sheets)
### Observations
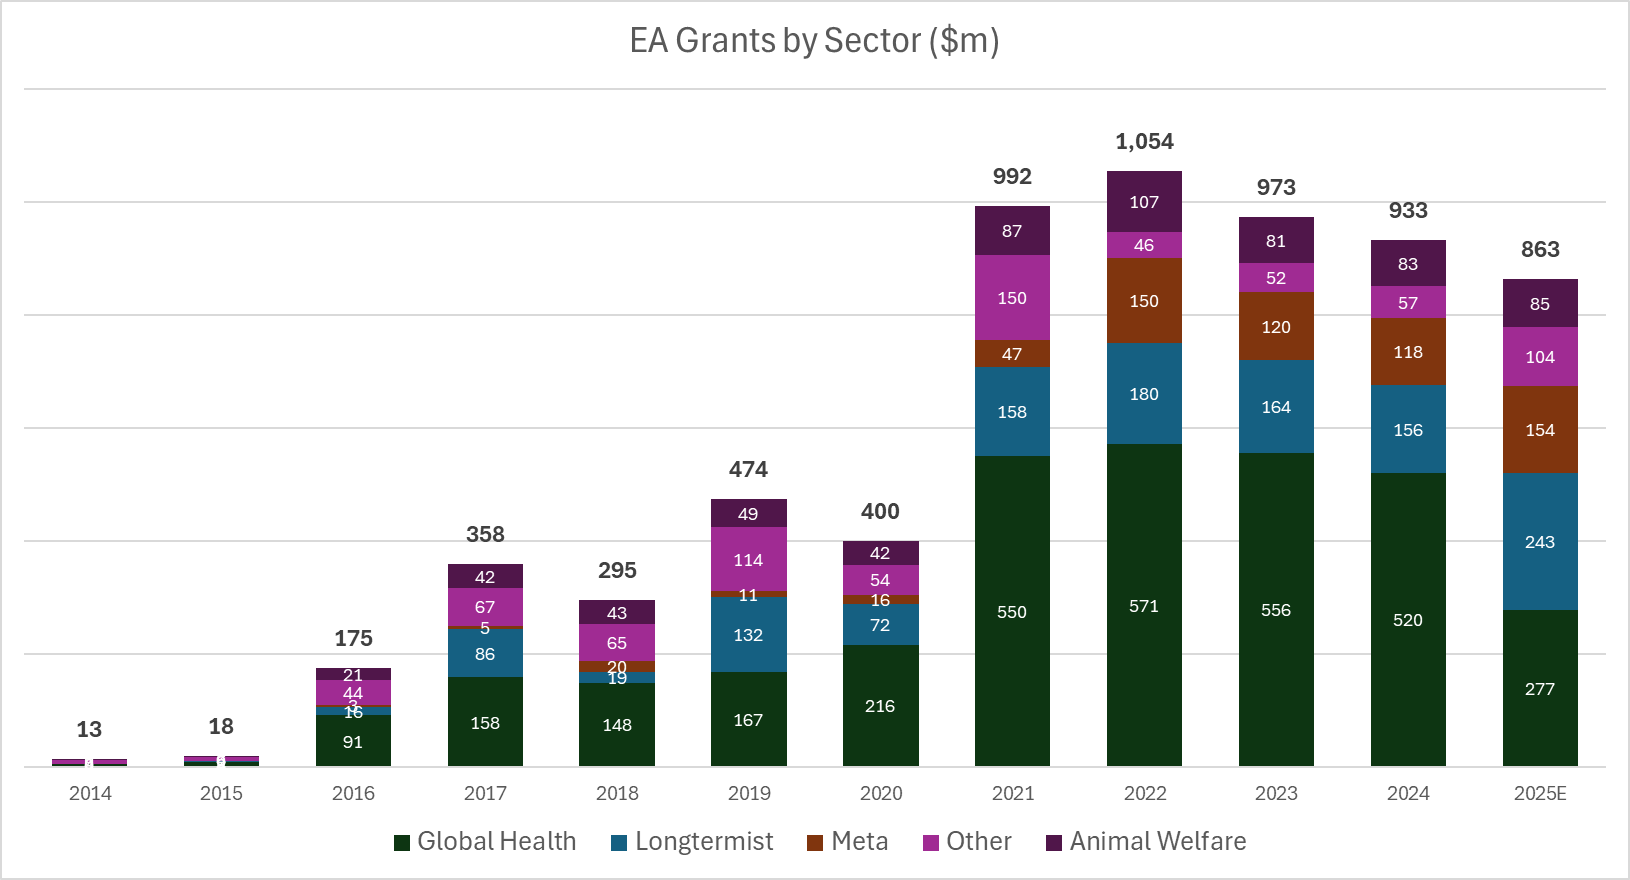
* EA grantmaking appears on a steady downward trend since 2022 / FTX.
* The squeeze on GH funding to support AI / other longtermist priorities appears to be really taking effect this year (though 2025 is a rough estimate and has significant uncertainty.)
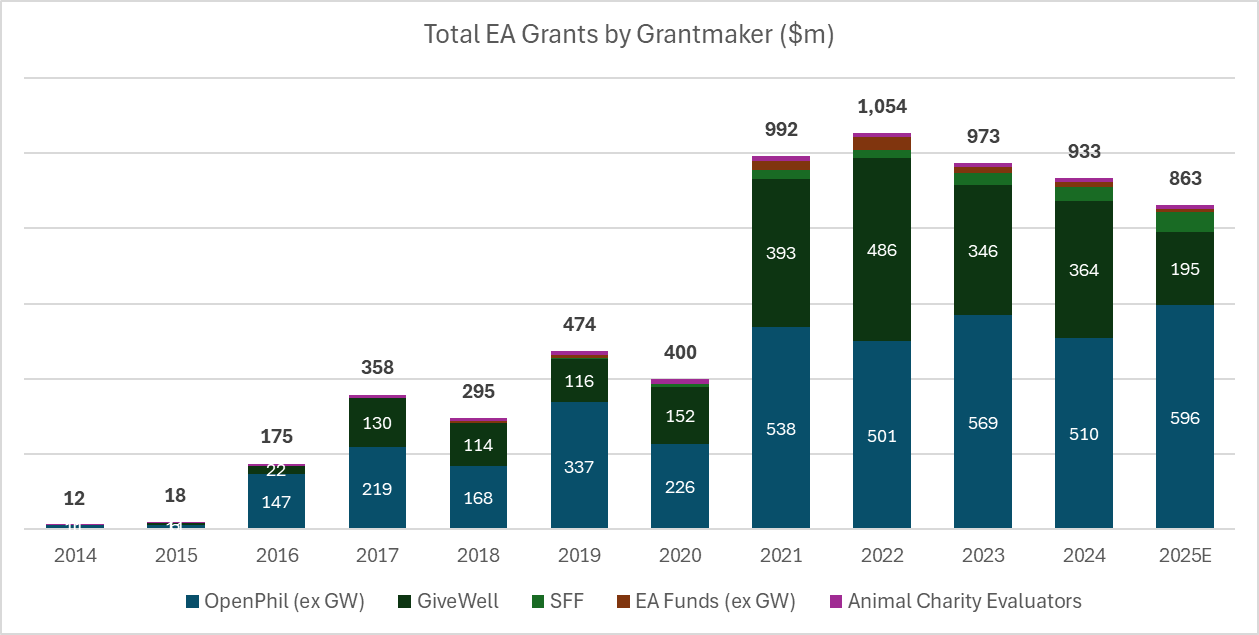
* I am really interested in particular about the apparent drop in GW grants this year. I suspect that it is wrong or at least misleading - the [metrics report](https://files.givewell.org//files/metrics/GiveWell_Metrics_Report_2024.pdf) suggests they are raising ~$300m p.a. from non OP donors. Not sure if I have made an error (missing direct to charity donations?) or if they are just sitting on funding with the ongoing USAID disruption.
(Edit note: I no longer endorse some of these observations; see "Updated data" section at the bottom of this post)
### Methodology
* I compiled the latest grants databases from [EA Funds](https://funds.effectivealtruism.org/grants), [GiveWell](https://airtable.com/appaVhon0jdLt1rVs/shrixNMUWCSC5v1lh/tblykYPizxzYj3U1L/viwJ3DyqAUsL654Rm), [OpenPhilanthropy](https://www.openphilanthropy.org/grants/), and [SFF](https://survivalandflourishing.fund/recommendations). I added summary level data from [ACE](https://animalcharityevaluators.org/about/impact/giving-metrics/).
* To remove double counting, I removed any OpenPhilanthropy grants that were duplicated in GiveWell's grant database. Likewise for EA Funds.
* I inflation adjusted to 2025 $ based on the [US CPI data from WorldBank](https://data.worldbank.org/indicator/FP.CPI.TOTL.ZG?end=2024&locations=US&start=1960&view=chart).
* For 2025 data, I made a judgement call on how much data was "complete" and pro-rated accordingly - e.g. from GiveWell, it looks complete up until the end of June, so I excluded an
... (truncated, 6 KB total)ac8c54fc08705be7 | Stable ID: sid_Q81aPjvsP0